Understanding intensity histogram
Each voxel (pixel in 2D, voxel in 3D) has brightness (luminance) information.
All the digital image data such as the pictures or TV screen are distributed by brightness information.
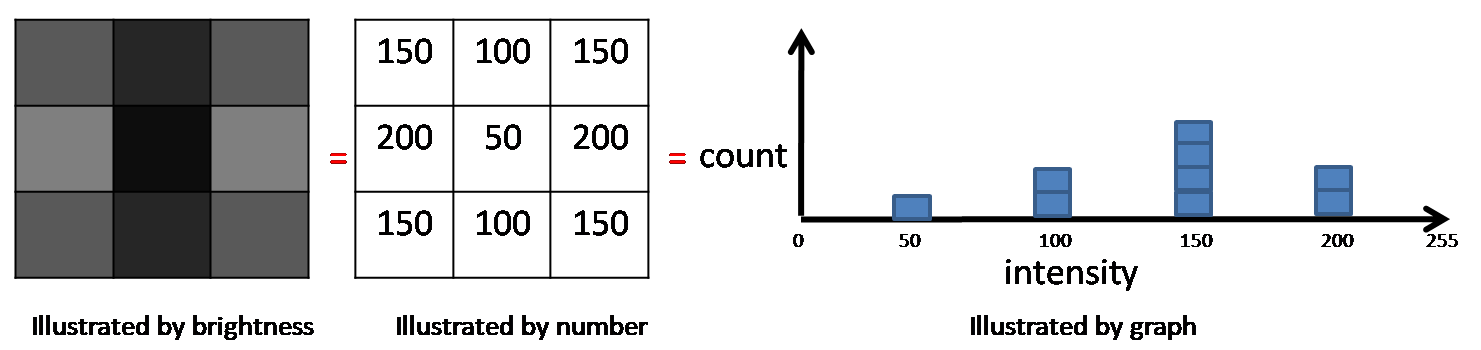
For example, the figure below has 3x3 pixels and unsigned 8 bits (brightness information from 0 to 255 for each pixel).
0 is black and 255 is white; it becomes brighter as the number goes up and darker as the number goes down.
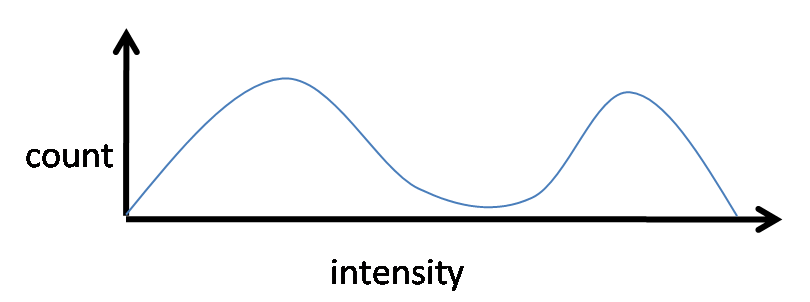
Whenever import data on rendering program, will see a intensity histogram like the below figure somewhere in the program.
It appears to be a curve but in reality is a set of bar graph in which lots of pixels or voxels are counted.